How We Figure Out The Score
By on February 8, 2017
Back in 2012 when we first launched the Long-term Quality Index site, Steve and I worked on putting together the Quality Index Rating (QIR).
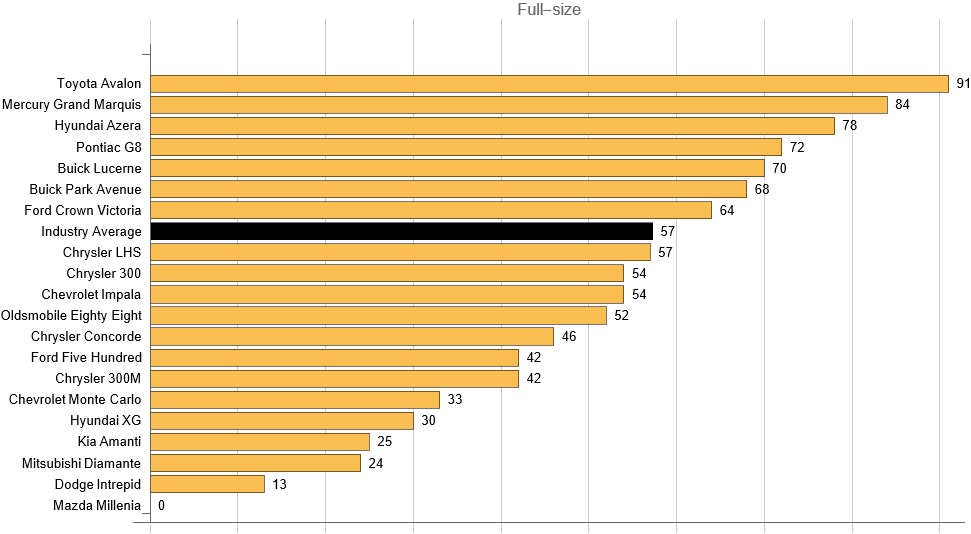
We made it simple. 50 was the average score which was then a Chevy Impala. 100 represented the best model which turned out to be the Toyota Land Cruiser, and those that hovered around 0 were rolling money pits like the Dodge Journey and Mazda Millenia.

That final number you see takes into account a number of different variables; engine issues, transmission defects, and the mileage and age that these defects take place.
On our initial roll-out, newer models had an easier time because they typically had relatively few engine and transmission issues. As our database has grown (1.3 million as of this writing), our rankings weren’t able to easily account for the fact that a 2 year old vehicle entered into the database 4 years ago represents a fairly different point in the lifetime of that vehicle than the 6 year old version of it today.
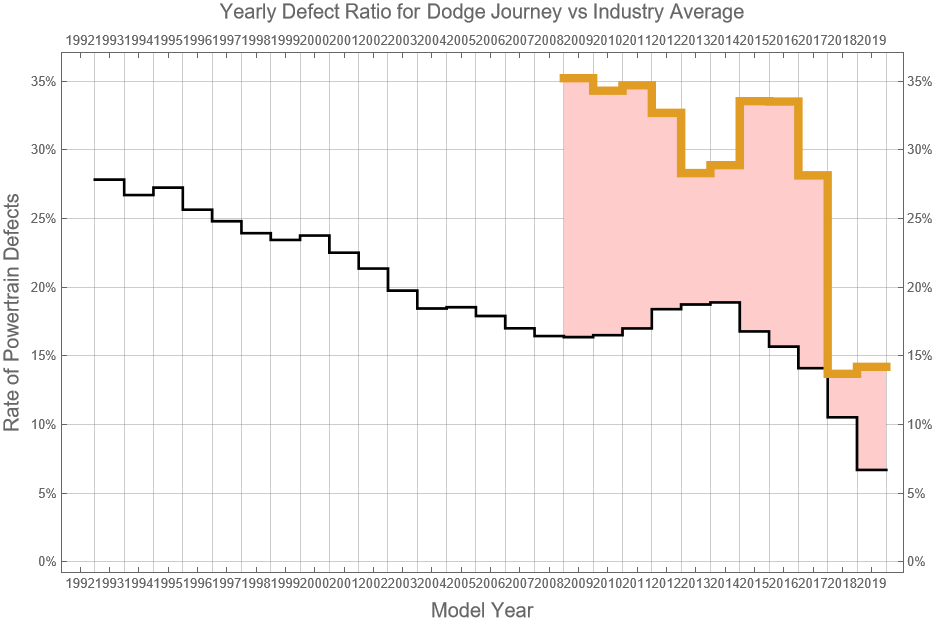
Steve and I have been looking at these concerns for some time, and we put together a revised version of the QIR to weigh these age and mileage issues. Long story short, a 20 year old model with over 200,000 miles will get virtually no lowering of its score. While newer vehicles that are serial offenders, like the Ford Focus and Dodge Journey, will get absolutely hammered.
Since these changes involve a bit of a shake-up, both within our top and bottom 10 rankings and for individual manufacturers, we wanted to give a bit of a run-down on what’s different, and which vehicles have moved around the most.

The biggest change involves the overall score. The basic idea with the revised rankings is that if only 5% of vehicles with the same mileage and model year have that issue, that issue will be ranked as far more severe than when 35% of vehicles have that same defect. The older a car is and the higher the miles, the less the penalty.
Now, as far as the impact on QIR scores goes, most vehicles don’t end up moving around too much (the average change in score was only around 0.5 points), but here are a few recent models that got pummeled due to chronic reliability issues:
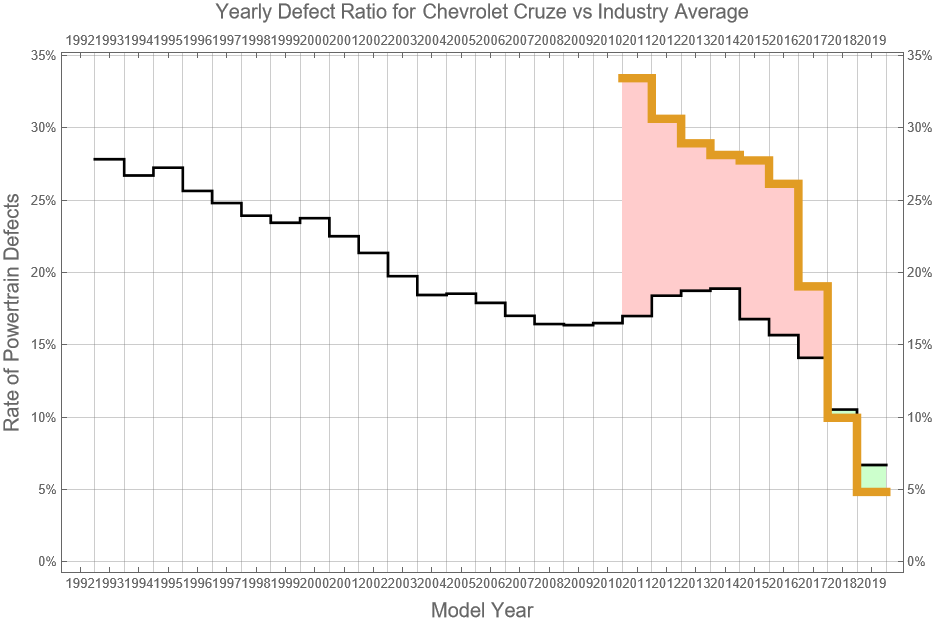
- Chevy Cruze (from 37 to 0)
- Kia Forte (from 35 to 1.8)
- Nissan 370Z (from 45 to 16.4)
- Hyundai Genesis (from 48 to 23.2)
The reason for the drop ends up being pretty similar for all of these; they’re generally “newer” models which previously benefited from an overall low rate of defects, but actually had substantially higher defect rates for their age than we would have expected.
Looking at the Cruze for example we can see that it’s rate of both engine and transmission issues are high for a vehicle that’s only been around since 2011.
On the other hand, a few vehicles that have a far longer history have moved up quite a bit:
- Chevy Corvette (from 64 to 96.6)
- Mercedes SL (from 61 to 94.8)
- Porsche Boxster (from 53 to 91.1)
- Cadillac Eldorado (from 31 to 72.8)
- Volvo 850 (from 14 to 61.5)
For a lot of these models their old QIR scores were depressed by the fact that many of these vehicles are older, and therefore have a higher instance of engine or transmission issues. We adjusted the age and mileage standards for these vehicles so that they are compared to other older vehicles instead of newer models. The Chevrolet Corvette for example has a large older sample size. We’re talking thousands of 1990s and early-2000 models. But those that are out there seem to be holding up much better than other vehicles from the same era.
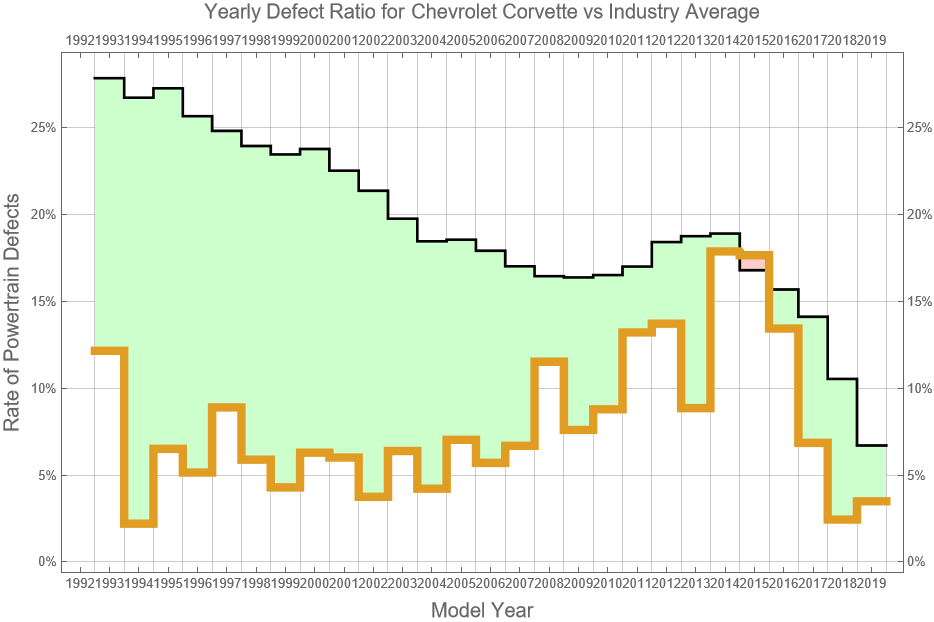
The Corvette’s improvement is actually enough to move it into our top 10 rankings.
Another feature this new model allows us to work on is having a ‘year-by-year’ Quality Index Rating.

In our new graphs, model years in green will be well above average to exceptional. Those in blue will be average, and red will represent the lowest quality vehicles in our study.
We feel like this new version of the index will more accurately expresses the reliability of a given make and model, and we will adapt it as we continue expanding our 1.3 million vehicle database.
Let us know what you think!